Do not build a Flask app until you have rejected the dashboards already inside Odoo.
Odoo 19 gives you four materially different routes: My Dashboard for saved views, Spreadsheet dashboards for business analysis, an OWL client action for a native custom interface, and an external Flask dashboard for users or systems that should not live in the Odoo web client. Pick by job—not by framework preference.
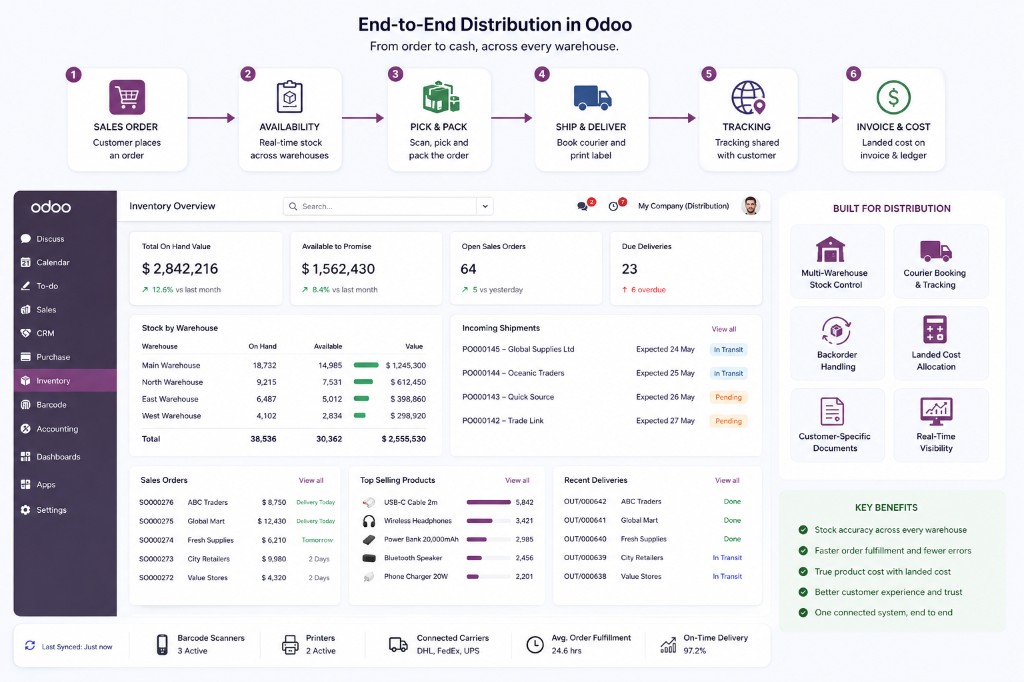
The decision: use My Dashboard to collect existing views; Spreadsheet dashboards for analyst-owned KPIs; OWL when the dashboard must behave like an Odoo app; Flask when it serves an external audience, combines several systems, or needs an independently deployed product experience.
“Real time” is not a framework. Define the acceptable freshness—on open, on refresh, every minute, or event-driven—before writing code.
Four ways to build an Odoo dashboard
| Approach | Best for | Code | Main limitation |
|---|---|---|---|
| My Dashboard | One place for saved list, pivot, graph, and other Odoo views | None | Composition, not a bespoke experience |
| Spreadsheet dashboard | Finance and operations KPIs owned by analysts | Low/no code | Edition/app access and spreadsheet-shaped interactions |
| OWL client action | Native Odoo workflow with charts, filters, drill-down, and actions | Python, JavaScript, XML | Must follow Odoo frontend lifecycle and upgrades |
| External Flask app | Customer/vendor portal, wallboard, cross-system dashboard, separate product | Python, HTML/JS, API layer | Separate auth, hosting, cache, observability, and API cost |
My Dashboard and Spreadsheet cover more than most teams test
Odoo’s Dashboards documentation distinguishes My Dashboard from Spreadsheet dashboards. My Dashboard centralizes Odoo views. Spreadsheet dashboards use tables and charts backed by Odoo data sources and refresh from the database.
Use Spreadsheet when the user’s real task is slicing sales by month, monitoring margin, comparing budget with actual, or presenting a filtered KPI board. It keeps the formulas and charts editable by a trained business user rather than freezing every change into a development ticket.
Check edition and installed apps before promising it. Odoo Spreadsheet is part of Documents, and dashboard customization has its own access rights. Community deployments often reach for an OWL addon or a third-party reporting module instead.
Use OWL when the dashboard is part of the Odoo job
Odoo’s web client is built with Owl components. The official Odoo 19 dashboard tutorial builds dashboard items, calls a statistics route, renders charts, lazy-loads content, and registers items to make the dashboard extensible.
A production dashboard normally has four pieces:
- An aggregation method or controller. Return totals and grouped series, not thousands of raw rows.
- An OWL component. Load data before render, hold filters in state, and destroy/rebuild charts cleanly.
- An
ir.actions.clientaction. Register the component in the actions registry and attach a menu. - Odoo security. The server method must respect companies, ACLs, and record rules. Hiding a chart in JavaScript is not access control.
Prefer read_group or a purpose-built reporting model for aggregates. Avoid search() followed by Python loops over an entire order history every time the page opens.
Use Flask when the dashboard should be independent of Odoo
Flask is justified when the audience should not receive Odoo accounts, the same screen combines Odoo with Shopify or a data warehouse, the dashboard must be deployed on its own cadence, or the UX is a public/kiosk/customer-facing product rather than an ERP menu.
The clean architecture is:
Browser
  → Flask routes / API
  → cache or reporting store
  → Odoo 19 JSON-2 (or a narrow custom endpoint)
  → dedicated Odoo integration user
Do not put an Odoo API key in browser JavaScript. Flask owns the credential server-side, queries only approved models and fields, and returns a dashboard-specific response. Odoo 19 keys have a maximum lifetime of three months, so rotation is part of the design—not a launch-day note.
On Odoo Online, external API access is tied to the Custom plan. Confirm that cost before selling an “independent dashboard” to a Standard-plan customer.
Design the KPI before the chart
A chart called “Revenue” is ambiguous. Define state, date, currency, company, refunds, tax treatment, and timezone. For example: confirmed untaxed sales, grouped by order date in the active company’s currency, excluding cancelled orders, with refunds shown separately.
- Metric owner: who signs off the number?
- Source model and domain: exact records included.
- Aggregation: sum, count, median, cohort, or snapshot.
- Freshness: request-time, cached, scheduled, or event-driven.
- Drill-down: which Odoo records explain the total?
- Permission: which companies and rows can this viewer see?
If two departments cannot agree on the definition, changing Chart.js will not fix the dashboard.
Fast dashboards return small answers
Aggregate on the server. Put indexes behind repeated domains. Limit date ranges. Cache expensive cross-system results. Cancel stale browser requests when filters change. Log latency and query volume. For external dashboards, use a reporting store when API calls cannot meet the audience or freshness requirement.
A useful target is a compact payload containing KPI values and chart series, not raw sale.order.line records. The UI should not become your analytics engine.
A dashboard project that does not start with pixels
- Write five KPI contracts and validate them against existing Odoo reports.
- Test whether My Dashboard or Spreadsheet already answers the job.
- If native interaction is required, prototype one OWL tile and its drill-down.
- If external access is required, prototype one Flask endpoint with a low-privilege user and key rotation.
- Test multi-company access, empty states, large date ranges, refunds, and revoked credentials.
- Add the visual system only after users trust the numbers.
Official documentation
FAQ
What is the best way to build a custom dashboard in Odoo 19?
Use Spreadsheet for analyst-owned KPIs, OWL for a native interactive Odoo screen, and Flask only when the audience or deployment should be independent of Odoo.
Can Flask connect to Odoo 19?
Yes. Keep the Odoo credential on the Flask server and call Odoo 19 JSON-2 with a dedicated, low-privilege user. Plan API-key rotation and confirm Odoo Online plan requirements.
Does Odoo Community have Spreadsheet dashboards?
Do not assume so. Odoo Spreadsheet is part of Documents. Community teams commonly use native views, custom OWL addons, or third-party reporting modules; verify the exact edition and installed apps.
Build the smallest dashboard that answers the decision
Trust the number before you polish the chart.
We can turn the five decisions that matter into a dashboard people actually use.